
Carbon emissions are a pressing global issue that has far-reaching consequences for our planet and future generations. The UK continues to feel the impact immensely, threatened by heatwaves, rising sea level, changing rainfall, etc.
As concerns about climate change continue to mount, understanding the basics of carbon emissions is crucial. In this blog post, we will explore what carbon emissions are, their scope, and current UK trends.
What is Carbon Emission?
Carbon emissions refer to the release of carbon dioxide (CO2) gases into the Earth’s atmosphere.
Carbon dioxide (CO2) is a trace gas naturally present in Earth’s atmosphere and is also prevalent in substantial quantities within the world’s oceans. Carbon dioxide (CO2) enters the atmosphere from various sources, including the burning of fossil fuels, decomposition of solid waste, deforestation, and chemical reactions in manufacturing.
It is produced as a by-product of cellular respiration and plays a vital role in photosynthesis, as plants, algae, and certain bacteria remove it from the air during carbon fixation.
Natural processes contribute to CO2 emissions through the carbon cycle, where nature typically balances CO2 production and absorption, involving oceans, soils, and forests as CO2 sinks.
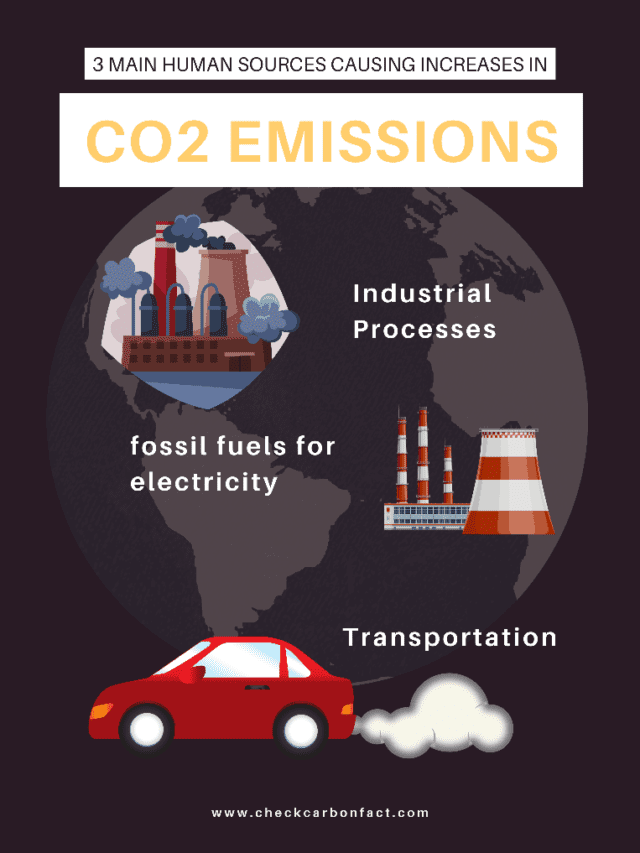
However, the balance of CO2 in the atmosphere remained relatively steady at around 280 parts per million (ppm) for thousands of years until the advent of the Industrial Revolution in the 18th century marked a turning point, as human activities, especially the consumption of fossil fuels for electricity, industrial processes, and transportation, significantly raised CO2 levels.
Since the industrialization era, CO2 emissions have increased significantly. The safe threshold for CO2 in the atmosphere is considered to be 350 parts per million (ppm), a limit surpassed in 1987.
Today, the atmospheric CO2 concentration exceeds 420 ppm, representing a staggering increase of over 30 per cent since then.
Why is Carbon Emission a Problem?
Excessive CO2 emissions have driven a 1.1-degree Celsius global warming since industrialization. Surpassing 1.5 degrees Celsius as stipulated by the Paris Agreement risks irreversible effects like sea level rise, extreme heatwaves, and species extinction, leading to societal challenges such as poverty, migration, and food and water scarcity.
Therefore, the climate change impact of carbon emission isn’t confined to the abstract global arena; it directly impacts businesses, their supply chains, real estate, and resource availability, underscoring its significance for the sustainability and resilience of both businesses and societies.
Is Carbon Emission the same as GHG Emissions?
Greenhouse gases play a vital role in driving climate change by effectively trapping heat and leading to a warmer global climate. They are instrumental in regulating Earth’s temperature by capturing solar heat within our atmosphere, ultimately causing a gradual increase in average atmospheric temperatures over time.
While carbon dioxide (CO2) is the most commonly discussed greenhouse gas in relation to carbon emissions, it’s crucial to understand that it’s just one member of a larger group of heat-trapping gases.
Other gases within the GHG group include methane (CH4), nitrous oxide (N2O), and fluorinated gases, all of which contribute to the spectrum of greenhouse gas emissions and significantly impact the Earth’s climate and ecosystems.
To create a standardized measurement for greenhouse gas emissions, scientists assess the warming potential of these emissions compared to their CO2 equivalent (CO2e). This method quantifies the emissions’ capacity to raise the Earth’s temperature at a rate equivalent to an equivalent quantity of CO2.
The United Kingdom experienced notable shifts in greenhouse gas emissions due to the COVID-19 pandemic and associated restrictions implemented in 2020 and 2021.
In 2021, the UK recorded net territorial greenhouse gas emissions totalling approximately 426.5 million tonnes of carbon dioxide equivalent (MtCO2e). This represented a 5.0% increase from the 2020 figure of 406.3 million tonnes but remained 5.3% lower than the 2019 level, which was the most recent year before the pandemic.
Notably, carbon dioxide constituted a significant portion, accounting for 80% of the total greenhouse gas emissions in 2021.
UK Carbon Emission & GHG Trends
The UK has been experiencing a gradual reduction in its overall CO2 emissions observed from 1990 to 2020.
The primary factor behind this decline since 1990 has been the reduction in emissions from industrial processes, including iron and steel production, resulting in a significant 41% decrease in carbon dioxide emissions since that time.
For instance, in 2021, emissions from the business sector were 33% lower than their 1990 levels, with the most substantial reduction occurring between 2001 and 2009. The sharp decline in 2009 was likely influenced by economic conditions.
CO2 emissions in the UK are primarily shaped by economic behaviours, the pricing of fossil fuels, and population growth.
The four sectors responsible for the highest levels of greenhouse gas (GHG) emissions in the UK have remained consistent over time: consumer spending, energy, manufacturing, and transportation.
Together, these sectors account for more than 71% of the UK’s total GHG emissions.
Conversely, initiatives aimed at combating climate change, such as transitioning to renewable energy sources, appear straightforward but entail complexities.
Presently, the UK is committed to achieving a reduction of at least 68% in economy-wide greenhouse gas emissions by the year 2030, in comparison to the levels observed in 1990.
How can Companies Assess the volume of CO2 Emissions they Produce?
Regardless of their industry, businesses wield significant control over direct and indirect emissions from their operations. The key to strategic management lies in comprehending these carbon emissions.
The IPPC has provided a simple formula for computing a business’s carbon footprint;
Activity (or consumption) X emission factor = GHG emissions
Activity data pertains to the extent of a carbon emissions-producing activity undertaken by a company, encompassing elements such as transportation mileage, electricity consumption, or industrial production.
Examples of activity data:
- Distance travelled by a fleet of delivery trucks in a year (i.e., 100,000 miles).
- Total energy consumption in a manufacturing plant (i.e., 5,000 MWh).
- Hours of operation for a commercial building’s HVAC system (i.e., 2,500 hours).
- Number of flights taken by employees for business travel (i.e., 500 flights).
- Tons of paper used by an office for printing and copying (i.e., 50 tons).
- Kilowatt-hours of electricity consumed by a data center (i.e., 2,000,000 kWh).
- Amount of water used for irrigation on a farm (i.e., 10,000 cubic meters).
- Gallons of fuel consumed by a fleet of delivery vans (i.e., 20,000 gallons).
- Number of employees commuting to work by car (i.e., 200 employees).
- Square footage of new construction in a real estate development (i.e., 50,000 square feet).
Complementary to this, emission factors represent the volume of greenhouse gases (GHGs) released or sequestered for each specific activity, essentially serving as coefficients that quantify GHG emissions or sequestration per unit of the GHG-producing activity.
Examples of emission factors:
- Carbon dioxide (CO2) emissions per gallon of gasoline burned in a car (i.e., 2.3 kg of CO2 per gallon).
- Nitrogen oxides (NOx) emissions from diesel trucks per mile driven (i.e., 0.2 grams of NOx per mile).
- Methane (CH4) emissions from a landfill site per ton of solid waste deposited (i.e., 20 kg of CH4 per ton).
- Sulfur dioxide (SO2) emissions from a coal-fired power plant per megawatt-hour of electricity generated (i.e., 1,000 grams of SO2 per MWh).
- Nitrous oxide (N2O) emissions from agricultural soil per hectare of land (i.e., 2 kg of N2O per hectare).
- Particulate matter (PM2.5) emissions from a factory’s smokestack per hour of operation (i.e., 5 grams of PM2.5 per hour).
- Carbon monoxide (CO) emissions from a natural gas furnace per million British thermal units (MMBTU) of heat produced (i.e., 50 grams of CO per MMBTU).
- Volatile organic compound (VOC) emissions from a paint manufacturing process per gallon of paint produced (i.e., 0.5 kg of VOC per gallon).
- Hydrochlorofluorocarbon (HCFC) emissions from air conditioning units per year of use (i.e., 0.1 kg of HCFC per year).
- Lead (Pb) emissions from lead-acid battery production per battery manufactured (i.e., 2 grams of Pb per battery).
These activities’ data fall within three primary emissions Scopes defined by the GHG protocol:
- Scope 1 (direct operational emissions)
- Scope 2 (indirect emissions from utilities)
- Scope 3 (indirect emissions along the value chain, including employees, suppliers, and consumers).
Despite the difficulty in quantifying them precisely, Scope 3 emissions often constitute the largest part of a company’s carbon footprint. Companies should therefore transparently report the Scopes included in their carbon footprint calculation.
Armed with this data, a company can develop a strategy for reducing carbon emissions, starting with selecting a baseline year and defining activity boundaries, then compiling consumption data, calculating GHG emissions, and finally, devising an organizational emissions reduction strategy.
Found it interesting and would like more in the mail?
